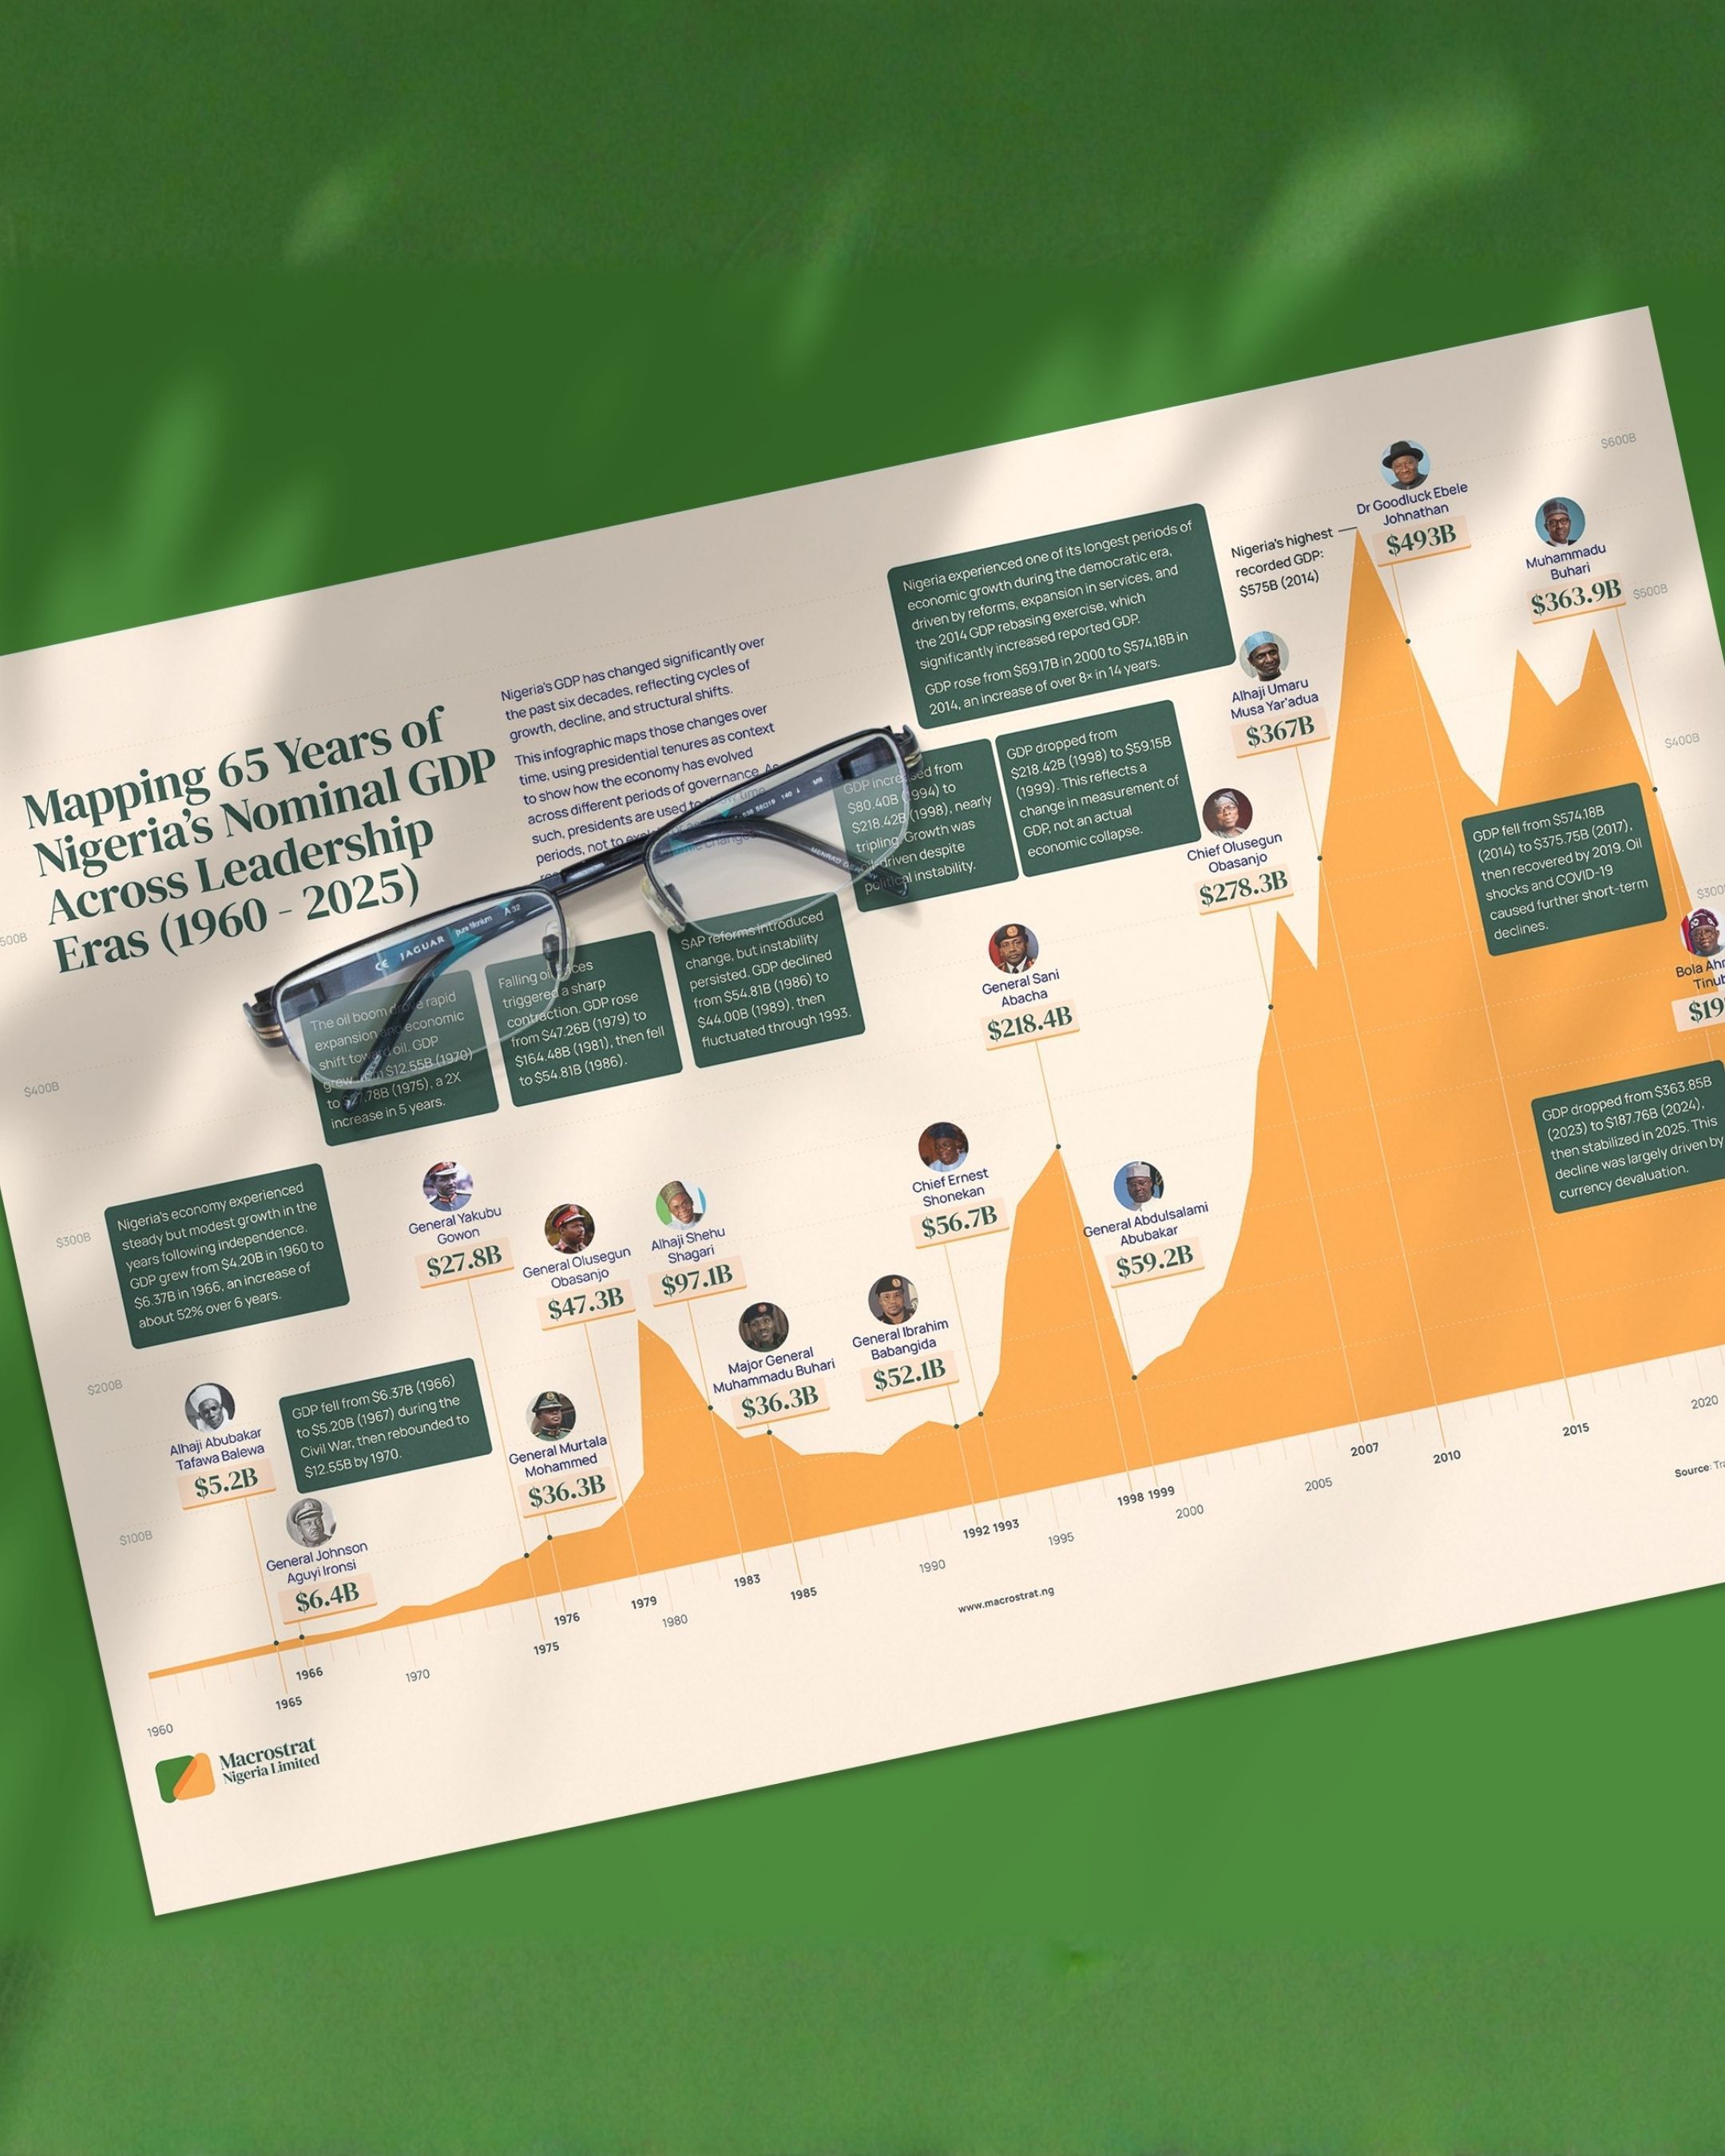
Nigeria’s GDP has changed significantly over the past six decades, reflecting cycles of growth, decline, and structural shifts.
This infographic maps those changes over time, using presidential tenures as context to show how the economy has evolved across different periods of governance. As such, presidents are used to show time periods, not to explain or assign responsibility for economic changes.
Get the infographic.